drivenn Follow
Get It On
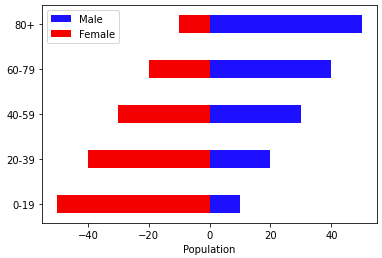
A population pyramid, also known as an age pyramid or age picture diagram, is a graphical illustration that shows the age and sex distribution of a population.
To create a population pyramid in Python, you can use the Matplotlib library.
Here's an example of how you can create a simple population pyramid using Matplotlib
Personal Text Here