Skip to the content
DrivennDrivenn
  • Get inspired
    • Graphs
    • Analytics
    • Dashboards
    • Reports
    • Know-How
    • Data Sources
    • API’s
    • Portfolios
  • Learn Analytics
Sign Up Sign In
  • Get inspired
    • Graphs
    • Analytics
    • Dashboards
    • Reports
    • Know-How
    • Data Sources
    • API’s
    • Portfolios
  • Learn Analytics
  • Yelp
  • Facebook
  • Twitter
  • Instagram
  • Email

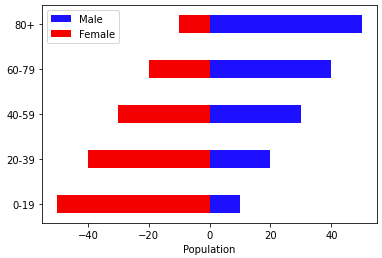
A population pyramid, also known as an age pyramid or age picture diag...

drivenn

0
461

Population Pyramids with ChartGPT

  • Sheets
  • Excel
  • Tableau
  • DataStudio

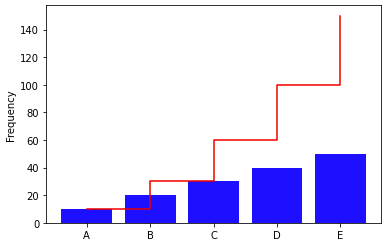
A Pareto chart is a type of visual representation that is used to disp...

drivenn

0
569

Pareto chart using ChatGPT

  • Sheets
  • Excel
  • Tableau
  • DataStudio

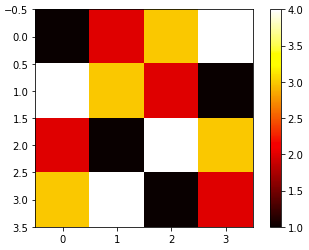
A heat map is a type of visual representation that is used to display ...

drivenn

0
396

Heat Map using ChatGPT

  • Sheets
  • Excel
  • Tableau
  • DataStudio

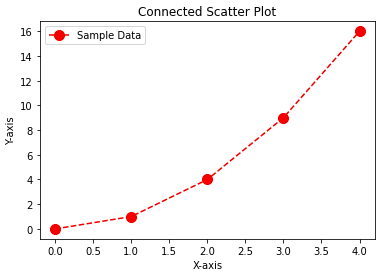
Connected Scatter Plor created with ChatGPT A connected scatter plot,...

drivenn

0
381

Connected Scatter Plot with ChatGPT

  • Sheets
  • Excel
  • Tableau
  • DataStudio

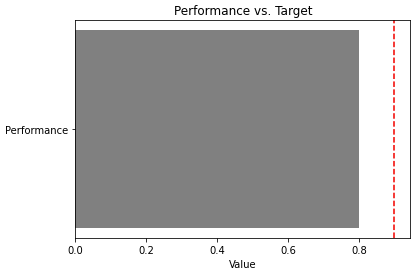
A bullet graph is a type of bar graph that is used to compare a perfor...

drivenn

0
317

bullet graph with chat GPT

  • Sheets
  • Excel
  • Tableau
  • DataStudio

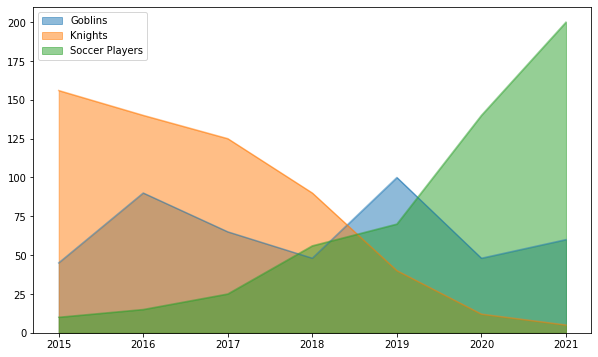
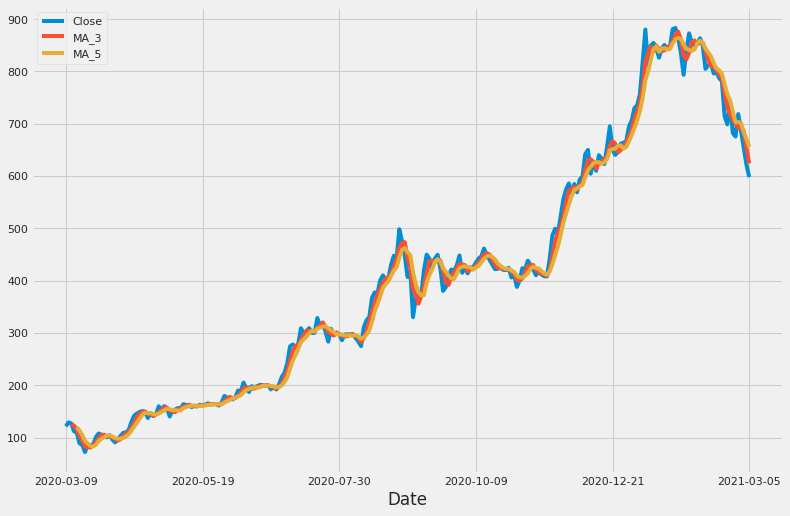
Time series analysis is a way of analyzing data points collected over ...

drivenn

0
309

Time Series Analysis

  • Sheets
  • Excel
  • Tableau
  • DataStudio

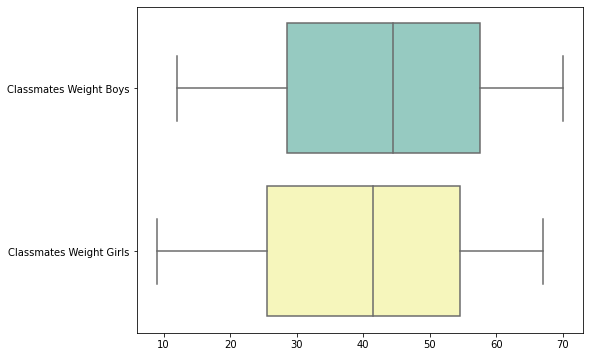
A box plot displays a five-number summary of a set of data, the minim...

drivenn

0
291

Box Plot

  • Sheets
  • Excel
  • Tableau
  • DataStudio

drivenn

0
256

Stacked Area Chart

  • Sheets
  • Excel
  • Tableau
  • DataStudio

Build your Data Analyst portfolio.
Share your skills and get feedback.

For you

  • Upload Content
  • Edit Profile
  • Exploe drivenn.io
  • Learn Analytics

Company

  • About
  • Support

  • Terms of Services
  • Privacy Policy
  • Contact

Brands

  • Brands Advertise with drivenn.io

© 2025 drivenn. All rights resereved.

© 2025 drivenn. All rights resereved.