drivenn Follow
Get It On
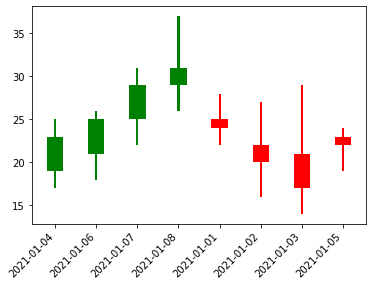
A candlestick chart to show and analyze the price movements over time.
These are typically used for derivatives, currencies, stocks, bonds, and commodities.
As far as their display, they show price information, like open price, close price, highest price, and lowest price.
Each symbol, or candlestick, represents trading activity during a specific time period."
Personal Text Here