drivenn Follow
Get It On
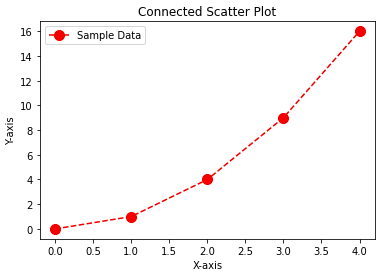
Connected Scatter Plor created with ChatGPT
A connected scatter plot, also known as a line chart or a line graph, is a type of chart that is used to visualize the relationship between two or more variables. It is called a "connected" scatter plot because it connects the individual data points with a line, allowing you to see trends and patterns in the data over time.
Personal Text Here