drivenn Follow
Get It On
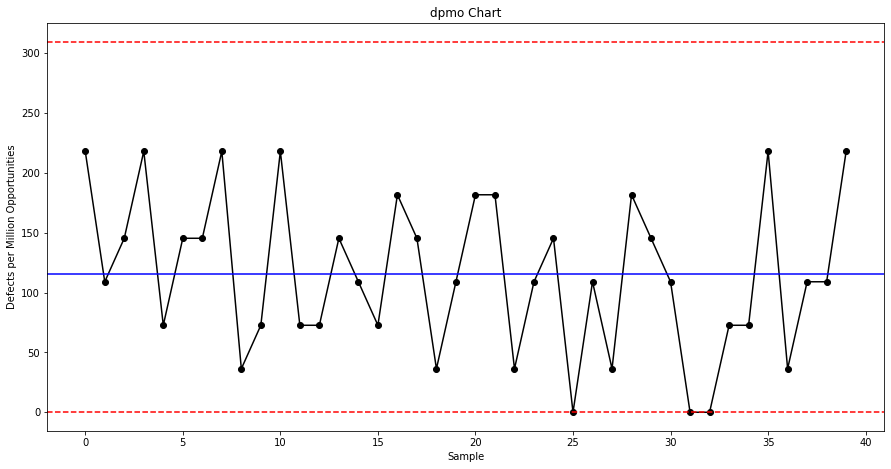
The control chart is used to track changes over time.
It contains a central line for the average, an upper line for the upper control limit, and a lower line for the lower control limit.
These lines are determined from historical data.
Personal Text Here