drivenn Follow
Get It On
Key Points -
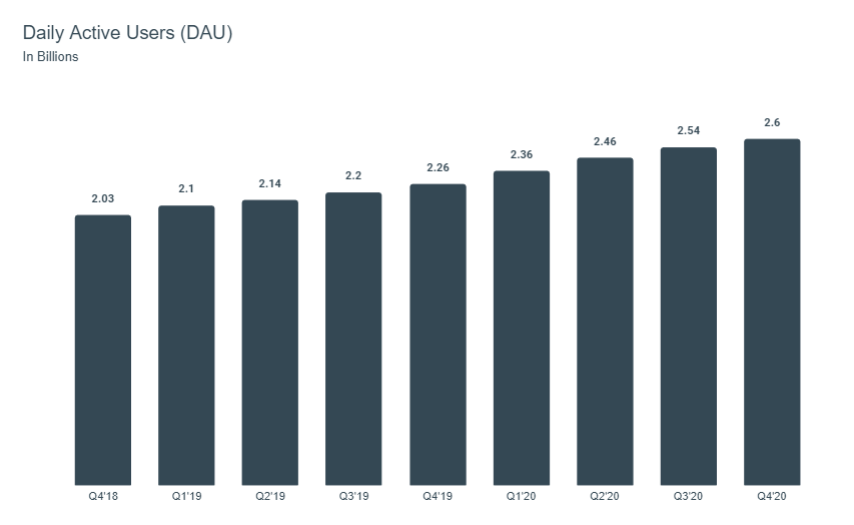
One slide - one graph, less is more
Start with the essence (Daily/Monthly Active Users) and not the revenue bottom line.
Color consistency - (Hex 344854, 677B8C, 93A4B2, D2DAE0)
No extra data on the graphs or percentage change calculations
Info about the KPI’s presented in tiny side notes
Keep the visualizations simple (Out of 18 visuals - 9 bar chars, 7 stacked bar charts,2 tables)
Based on https://investor.fb.com/investor-events/event-details/2021/Facebook-Q4-2020-Earnings-/default.aspx
Personal Text Here